

Chart Other
The options on the Other page depend on whether you are working with a chart report or a chart included in a quick or cross-tab report. Both types have these options:
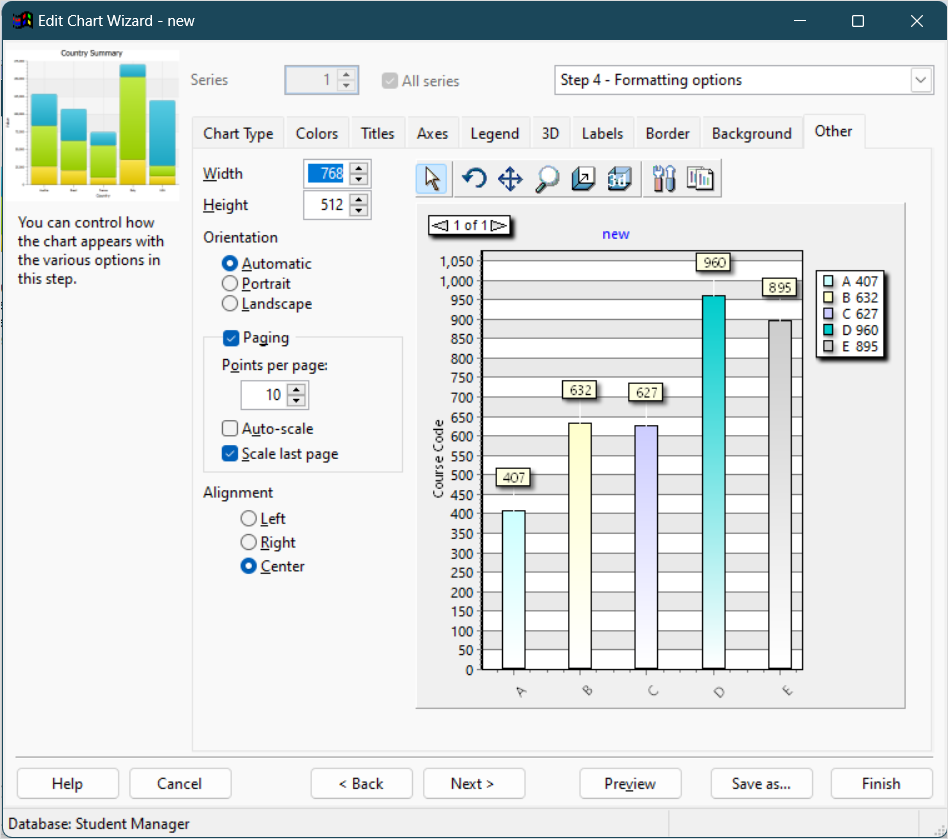
Width: specifies the width of the chart in pixels when it's output.
Height: specifies the height of the chart in pixels when it's output.
Points per page: set this to the number of data points you want on each page; 0 means put them all on the first page.
If you are working with a chart report, other options are available:
Orientation: the default choice, "Automatic," means that if the chart is too wide to fit in portrait orientation, it automatically switches to landscape. However, you can override this by choosing either "Portrait" or "Landscape" to force the report to be printed in the desired orientation.
Paging: the paging settings allow you to create multi-page charts. If you don't turn on paging and your chart has more than 300 data points, you'll get a warning that the report can't run because there are too many data points. Turn on Paging to enable the other options.
Auto-scale: turning this on scales the horizontal axis automatically based on the number of data points displayed.
Scale last page: this determines how the last chart page is displayed. Turn this on to have the last page use the same horizontal scaling than the other pages. Turning it off adjusts the page scaling based on the number of points on that last page.