

Dashboard Report
A dashboard is a set of reports that appears in its own window, outside of Student Manager Reports. In fact, when a dashboard is run, the normal Student Manager Reports user interface doesn't appear.
You must have an Ultimate license to create or edit dashboards.
You typically run a dashboard to view important information about your business. You may run a dashboard at the start of the day and leave the dashboard window open all day, or open and close it as you see fit. The reports in the dashboard refresh themselves at an interval you specify (the default is every ten minutes) so the data is always current.
If the total number of cells in the dashboard is less than the number of reports, the reports are cycled through in sets at the specified interval. For example, if you specify two rows and two columns, only four reports can be displayed at a time, so if the dashboard contains six reports, the first four are displayed, then the next two, then the first four again.
To run a dashboard, double-click the shortcut on your desktop Student Manager Reports created when you created the dashboard. Resizing the dashboard window resizes the reports within the window so you can make the window a convenient size. Each report in the dashboard displays with a title bar that changes color when your mouse pointer is over the chart. There are three controls in the upper-left corner of each report's title bar:
Document: click this button to output the reports to a PDF file. You are asked for the name and location of the file to output to.
Zoom: click this button, which only appears when there's more than one report in the dashboard, to zoom the report up to fill the dashboard and hide the other reports. Click it again to restore the size of the report.
Refresh: click this button to refresh the report immediately without waiting for the refresh interval.
You can also run a dashboard by previewing it in Student Manager Reports, either in the Reports Explorer or in the Dashboard Wizard. Note that the Print, Schedule Report, and Show SQL Statement functions are disabled, as are all pages in the Reports Explorer except the Information page, when a dashboard is selected since those things don't apply to dashboards.
Note that reports such as quick or cross-tab reports only display the first page of the report and cannot be scrolled, since a dashboard is intended to show a quick display of information.
To create a dashboard, follow the steps in the Creating a Report topic, and select the Dashboard report type.
Step 1 Main Report Information
The first step in this wizard is to enter the following information:
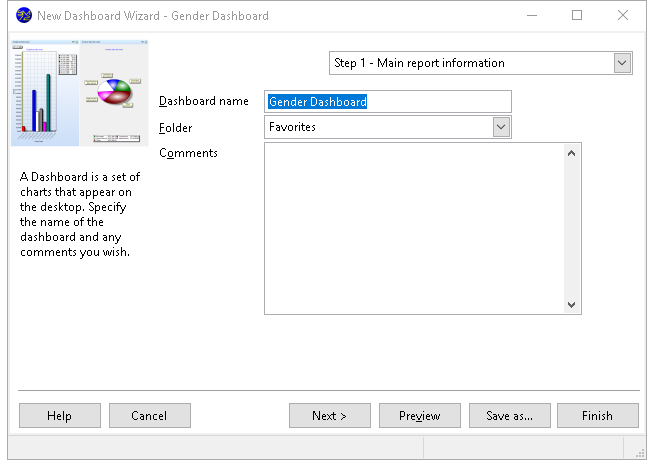
Dashboard name: the name of the dashboard. If you enter the name of an existing report or dashboard, an error message displays. You can't use a backslash ("") in a dashboard name; the computer will beep if you press that key. You cannot go to the next step until you have entered a valid name.
Folder: the folder this dashboard belongs in. The default is the current folder in the Reports Explorer. You can select the desired folder by clicking the down arrow beside the folder name and choosing the folder in the list that appears. To expand a folder, click the + sign in front of the folder name; the + sign changes to a - sign. To collapse a folder, click the - sign in front of the folder name; the - sign changes to a + sign. To select the desired folder, either click it and click the down arrow again to close the list or double-click it.
- Comments: any comments entered here appear in the Reports Explorer when the dashboard is selected.
Step 2 Select Dashboard Reports
Step 2, in which you select which reports appear in the dashboard, is shown below:
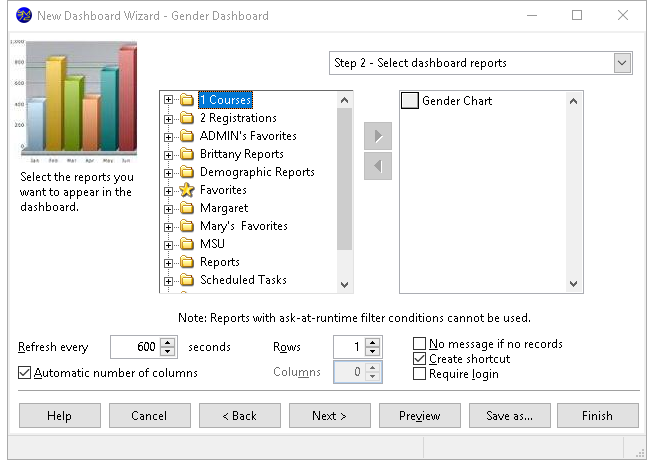
The options in this step are:
A list containing all reports that have not already been selected appears at the left. The reports are organized in the same folders they are in the Reports Explorer; click the + sign in front of a folder to expand it and see the list of reports it contains. Reports that have ask-at-runtime filter conditions are disabled and cannot be selected because dashboards may run unattended and therefore shouldn't prompt the user for any values.
A list showing the reports included in the dashboard appears at the right. Reports in this list may be moved up and down to change the order in which they appear in the dashboard; to do this, click the button in front of the report to move and drag the button up or down in the list.
Add: clicking this button adds the selected report in the available list to the selected list. You can also add the report by double-clicking it in the available list. The report is removed from the available list.
Remove: clicking this button removes the selected report from the selected list. You can also remove the report by double-clicking it in the selected list. The report is added to the available list (although you may not see it if the folder the report is from isn't expanded).
Refresh every: a dashboard automatically refreshes the data in its reports at an interval you determine. The default is every 600 seconds (10 minutes) but you can set it between 1 and 6,000 seconds. This interval is also used to display sets of reports; see the note below.
Automatic number of columns: if this option is turned on (the default), the dashboard window determines how many columns to display based on the number of reports and the number of rows. For example, if there are six reports and two rows, the dashboard has three columns. Turn this setting off to manually set the number of columns, especially if you want to cycle through sets of reports (see the note below).
Rows: the number of rows to display reports in. The maximum value is the number of reports in the dashboard; for example, if you've selected three reports, you can have up to three rows (one per report).
Columns: the number of columns to display reports in. The maximum value is the number of reports in the dashboard; for example, if you've selected three reports, you can have up to three columns (one per report). This option is disabled if Automatic number of columns is turned on.
If the total number of cells (rows multiplied by columns) is less than the number of reports, the reports are cycled through in sets at the specified interval. For example, if you specify two rows and two columns, only four reports can be displayed at a time, so if the dashboard contains six reports, the first four are displayed, then the next two, then the first four again.
No message if no records: with this setting turned off, when the dashboard is run and the filter for a report causes no records to be retrieved, a warning message is displayed. Turn on this setting on to not display the warning.
Create shortcut: turn this option on, which it is by default, to create a shortcut on your desktop that runs the dashboard. To run the dashboard, simply double-click the shortcut; you don't need to start Student Manager Reports first and the normal Student Manager Reports user interface doesn't appear.
Require login: turn this option on if you want to prompt the user to log in when they run the dashboard from a shortcut. With this option turned off, the dashboard runs without login. This option is only enabled if Create shortcut is turned on.
Step 3 Security Options
The options in Step 3 allow you to determine who can access your dashboard and what they can do with it.
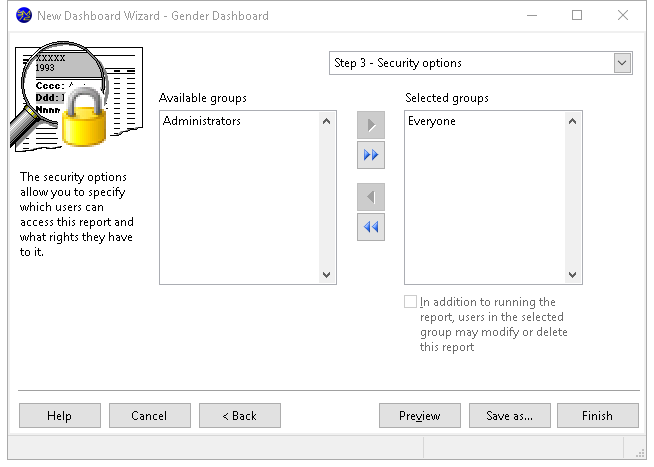
The options in this step are:
Available groups: this shows which user groups do not have access to this dashboard.
Selected groups: this shows which user groups have access to this dashboard. By default, the Everyone group has access to a new dashboard, so all users can see it. If you want only certain users to see it, remove the Everyone group from the Selected list and add the appropriate groups from the Available list. If no groups have access to the dashboard, the dashboard is essentially private, available only to you.
Add: clicking this button adds the selected group in the Available list to the Selected list. You can select several groups by holding down the CTRL key as you select them; clicking Add adds all selected groups to the Selected list. You can also add the group by double-clicking it in the Available list, selecting it and pressing ENTER, or dragging the group from the Available list to the Selected list. The group is removed from the Available list.
Add all: clicking this button adds all groups from the Available list to the Selected list.
Remove: clicking this button removes the selected group (or groups if you have selected more than one) from the Selected list. You can also remove the group by dragging it from the Selected list to the Available list. The group is added to the Available list.
Remove all: clicking this button removes all groups from the Selected list, and adds them to the Available list.
In addition to running the report, users in the selected group may modify or delete this report: turn this option on if the selected group in the Selected list can edit or delete this dashboard; if this item is turned off, only you are able to do so.