

Chart Titles
The Titles page has the following options:
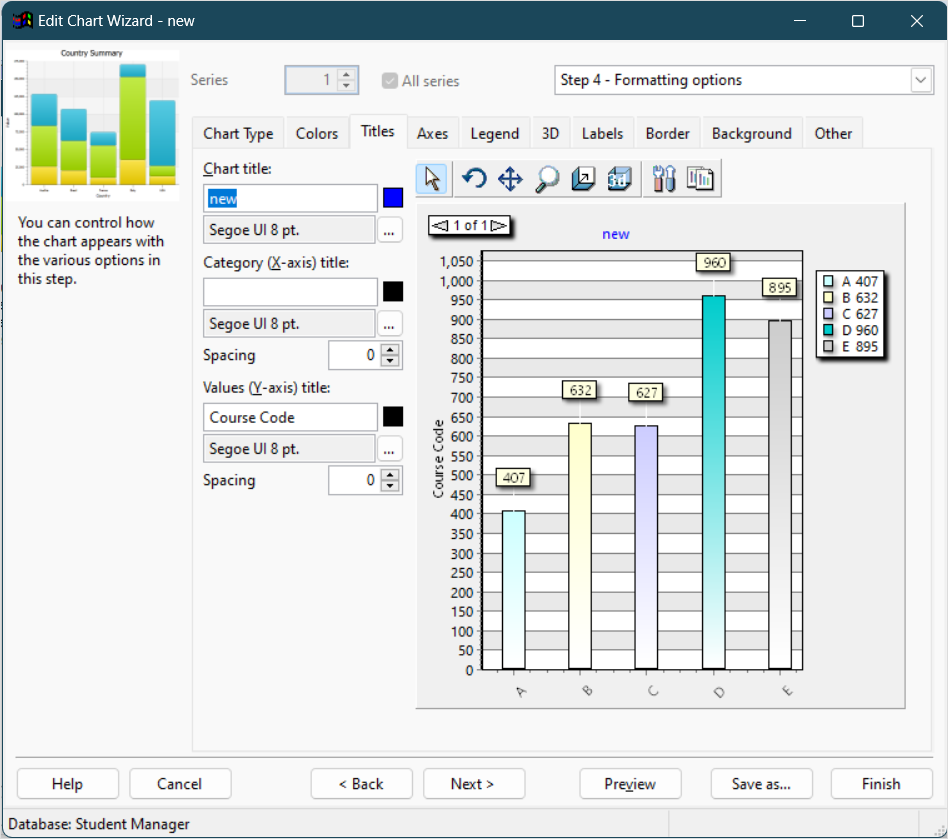
- Chart title: specifies the text, color, and font for the title of the chart. The default title is the name of the report. To change it, type a new title in the text box. To change the color of the text, click the colored square beside the title and select the desired color from the dialog that appears. To change the font or size, click the ... button and select the desired font and size from the dialog that appears. Note that if you select a font script other than Western, the script name (such as "Greek") appears after the font name, size, and style.
If you want to use an expression rather than fixed text, such as a user-defined function, add
{and}around field or function names in the text. (Previous versions allowed you to enter an equals sign followed by an expression; this is still supported but braces are easier to use.) Here's an example of an expression that displaysSales for <spelled out month> <year>(such as "Sales for December 2001") in the chart title:
Sales for {cmonth(date())} {year(date())}
Here's an expression that uses the built-in GetConditionValue function, which returns the value of a filter condition for the specified field, to display a header showing "Sales for " a particular country the report is filtered on:
Sales for {GetConditionValue('customers.country')}
Expressions can even include fields from the result set for the report.
If you want to include the chart total in the expression, use the built-in variable ChartTotal. Here's an example that formats the total as a currency to two decimals places:
{Format('My Chart: Chart total = <0:c2>', ChartTotal)}
Category (X-axis) title: specifies the text, color, and font for the title of the category, or X, axis; this option is unavailable for pie and donut charts since they don't have an X axis. The default title is the name of the category field. To change it, type a new title in the text box. To change the color of the text, click the colored square beside the title and select the desired color from the dialog that appears. To change the font or size, click the button with the ellipsis (...) and select the desired font and size from the dialog that appears. Note that if you select a font script other than Western, the script name (such as "Greek") appears after the font name, size, and style. To set the spacing between the title and the X axis, enter the desired value for the spacing; 0 means automatically determine the spacing.
Values (Y-axis) title: specifies the text, color, and font for the title of the value, or Y, axis; this option is unavailable for pie and donut charts since they don't have a Y axis. The default title is the name of the values field. To change it, type a new title in the text box. To change the color of the text, click the colored square beside the title and select the desired color from the dialog that appears. To change the font or size, click the button with the ellipsis (...) and select the desired font and size from the dialog that appears. Note that if you select a font script other than Western, the script name (such as "Greek") appears after the font name, size, and style. To set the spacing between the title and the Y axis, enter the desired value for the spacing; 0 means automatically determine the spacing.
Right Y-axis title: specifies the text, color, and font for the title of the right Y axis; this option is only available if there is a field plotted on the right-axis. The default title is the name of the field. To change it, type a new title in the text box. To change the color of the text, click the colored square beside the title and select the desired color from the dialog that appears. To change the font or size, click the button with the ellipsis (...) and select the desired font and size from the dialog that appears. Note that if you select a font script other than Western, the script name (such as "Greek") appears after the font name, size, and style. To set the spacing between the title and the Y axis, enter the desired value for the spacing; 0 means automatically determine the spacing.