

F9 Dashboard Report
The Dashboard gives you a quick look at courses with low enrollment, courses full or nearly full, summary of enrollments and income (for the day, week, quarter, year), and counts of web enrollments.
To open the Dashboard, press the F9 key.
Courses Close to Full
To view courses that are close to full:
- Select the Courses within [number] or less of max.
- Select the number, i.e. how close to the maximum the courses should be.
- Select your date range (the current month is auto-entered for you, but you can change that if desired).
- Click the Refresh Display button.
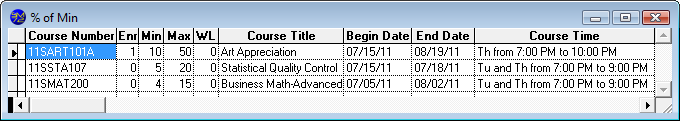
The courses that meet your criteria will show in the window to the right of the Show button. The first column shows the enrollment percentage of maximum. The second column shows the course code.
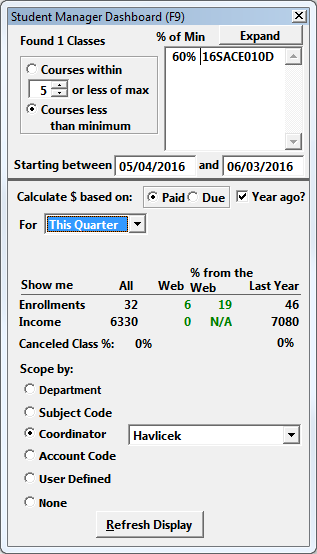
Courses Less than Minimum
To view courses that have not met minimum enrollment:
- Select the Courses less than minimum.
- Select your date range (the current month is auto-entered for you, but you can change that if desired).
- Click the Refresh Display button.
The courses that meet your criteria will show in the window to the right of the Show button. The first column shows the enrollment percentage of maximum. The second column shows the course code.
Expand Button
Click the Expand button to see more course details:
Enrollment Statistics
To see enrollment statistics for a given time period:
- Select the appropriate time period from the For [time period] show me drop down. For example, to see statistics for the past week, select ‘This Week’.
- If you want to scope this list, select the appropriate Scoping option. For example, to scope by Department, select ‘Department’ from the ‘Scope by the following’ list then select the specific department from the drop down.
- Click the Refresh Display button.
The enrollment count, income* and percentage of Canceled Class will be displayed for you.
Web Enrollment Statistics (ACEweb Users)
To see web enrollment statistics for a given time period:
- Select the appropriate time period from the For [time period] show me drop down. For example, to see statistics for the past week, select ‘This Week’.
- If you want to scope this list, select the appropriate Scoping option. For example, to scope by Department, select ‘Department’ from the ‘Scope by the following’ list then select the specific department from the drop down.
- Click the Refresh Display button.
The web enrollment count and income* will be displayed for you.
*Income is based on amount paid.