

Adding Report Elements
Add data fields, text, lines, boxes, and graphics to your report template.
Add Field from Cursor
You can add fields from the Report Cursor:
- Click the Data Environment button on the Report Designer Toolbar.
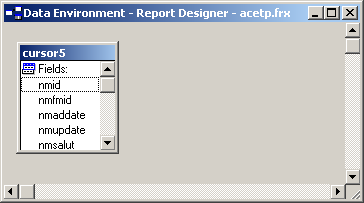
- Scroll through the list of available fields to find the field you want.
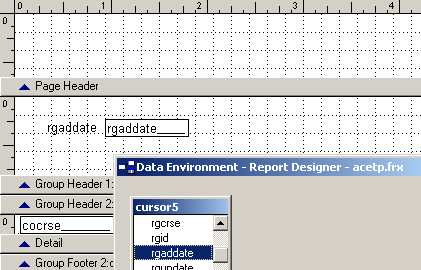
- 'Pick up' the field and drag it to the report (i.e. put the mouse over the field name [e.g. rgaddate], click and hold down the mouse button, then move the mouse to where you want to put the field in the report).
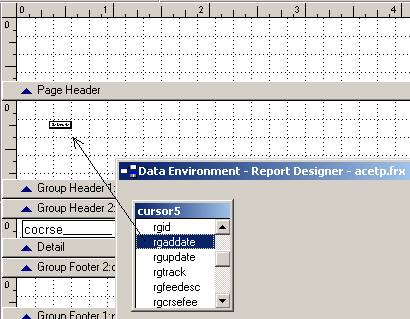
- 'Drop' the field where you want it to be placed (i.e. let go of the mouse where you want the field to be). The field and label will be placed on the report.
Add Field in Expression Box
You can add a field directly into an expression box:
- Click the ab tool on the Report Controls Toolbar.
- Click where you want to place the expression and draw a box.
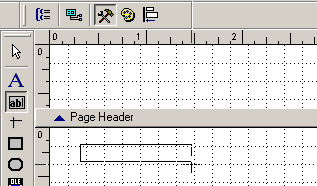
- When you release the mouse button, the Report Expression window will open.
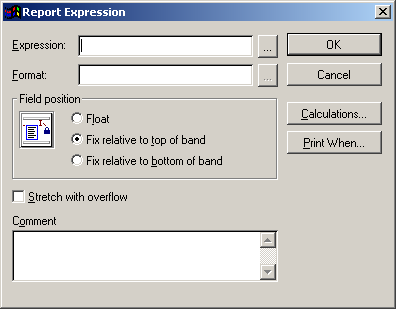
- Type the field name into the Expression field.

- Click the OK button to close the Report Expression window and return to the report template. Your field will be added to the template. Note: when you add a field with an expression box, no label is created.

Add Multiple Elements to Expression Box
You can add more than one field to an expression box*. To do so, you must enter your field names separated by one of the following concatenators:
Comma (,): places a space in between the fields, i.e. Sharon Brookshire

Semi-colon (😉: places a carriage return between the fields, i.e.:
President
ACEware Systems, Inc.

Plus sign (+): add fields (and/or text elements as in the following example) together without any spaces or returns, i.e. Manhattan, KS

*You fields must be of the same type. Fox example, you can’t combine a character field and a date field. If they are not the same type, you must use a report function to turn the date field into a character expression to include it in the same expression with a character field.
Add Field with Report Function
If the field you want to include in your report is not in the report cursor, you can usually access it with an add type Report Function. For example, this expression uses the ADDNAME() function to add the nmcode1 field to the report when it's not in your cursor.

Add Text Entries
You can add text entries (e.g. report title, field label, etc.) to your report. Each text can hold 256 characters (including spaces and carriage returns).
- Click the A tool on the Report Controls Toolbar.
- Click where you want to place the text. You'll see a blinking cursor where you clicked.

- Begin typing your text.

Edit Text Entries
To edit a text entry:
- Click the A tool on the Report Controls Toolbar.
- Click into the text entry you want to edit.

- Make the changes.
Add Lines
To add a line to the report template:
- Click the Line Tool on the Report Controls Toolbar.
- Click and drag the line--either vertically or horizontally--to the length you want.

- Release the mouse. The line is placed on the report template.
Line Formatting
- To change the thickness of the line, select Format > Pen, then select a size option.
- To change the color of the line, select Format > Foreground Color, then select the color (or use the Color Palette Tool Bar to change the color).
Add Boxes
Add squared or rounded boxes to your report with the Rectangle tools. Before you add a rectangle, you must determine the type of rectangle you want to add (i.e. squared or rounded). Next you must decide the fill and border type. The defaults are black border and no fill color.
To add a rectangle:
- Click the Rectangle tool or the Rounded Rectangle tool on the Report Controls Toolbar.
- Draw a box on the report template.

- Release the mouse. The box is added to the template.
Box Formatting
You can change the format of the box
- To change the thickness of the line, select Format > Pen then select a size option.
- To change the fill type, select Format > Fill then select the fill type.
- To change the fill color, select Format > Background Color then select the color (or use the Color Palette Tool Bar to change the fill color).
- To change the border color, select Format > Foreground Color then select the color (or use the Color Palette Tool Bar to change the border color).
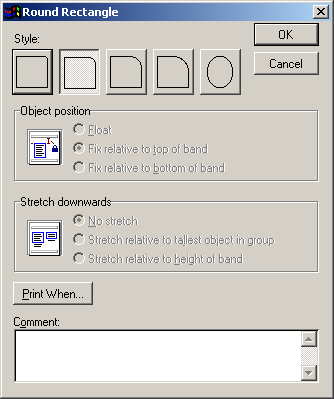
If you selected the Rounded Rectangle, you may also select the rounding style. To do so, draw the rectangle, then double-click it to open the Round Rectangle window. Then select the Style.
Add Images
Place a link to images in reports (e.g. organization's logo). The Report Designer recognizes the following graphic types: bmp, gif, jpg, png, and tiff.
IMPORTANT NOTES
- The graphics you use in your reports must be in a public location that other users can access. We suggest you place the graphic in your Student Manager folder, or create an Images folder within your Student Manager folder and place the graphic in it.
- Some PDF readers (e.g. Adobe Reader) will not properly render images that have transparent backgrounds. This is not a Student Manager bug, but an issue with how the PDF reader renders your image. If you experience this on PDFs created in Student Manager, you will need to use an image that has a background color.
To add an image
- Click the Picture Tool on the Report Controls Toolbar.
- Click where you want to place the graphic and draw a box.
- When you release the mouse button, the Report Picture window opens.
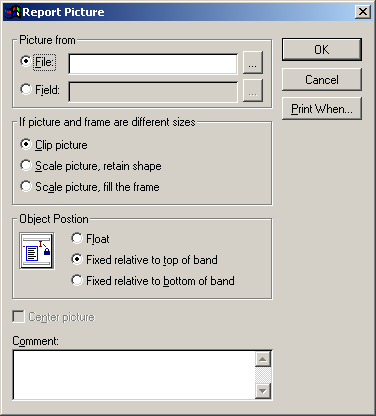
- Click the ... button to the right of the File field). This opens the Open window for you to find and select your graphic file.
We suggest you place graphics used in Student Manager reports in an Image subfolder of your Student Manager directory. This makes them available for anyone who needs to run the report. If you select a graphic that is stored on your computer, only you will be able to run the report (i.e. the path to the graphic will not be correct for anyone else, so they will get an error when trying to run the report).
- Select the graphic, then click the OK button.
- This will return you to the Report Picture Window. You can now determine picture/frame resizing and placement options.
- Clip Picture – If the picture is bigger than the frame you created, shows a section of the original picture in the frame, retaining the picture's original dimensions. The picture is anchored at the top and at the left of the frame. You cannot see the lower right portion of the picture that extends beyond the frame.
- Scale picture, retain shape - Displays the whole picture, filling as much of the frame as possible while retaining the relative proportions of the picture. This will protect your picture from vertical or horizontal distortion.
- Scale picture, fill the frame - Display the whole picture, filling the frame completely. If necessary, the picture will be distorted vertically or horizontally to fit the frame.